|
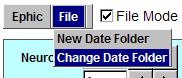
Start Ephic.
|
|
|
Change the date folder.
|

|
|
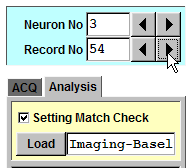
Select the neuron (or slice).
|

|
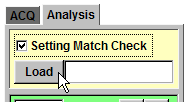
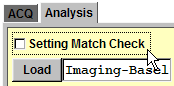
To find the first baseline recording, Check "Setting Match Check".
Load "Imaging-Baseline.set" by clicking the "Load" button and
following the instructions.
Click ">" button by "Record No".
|

|
|
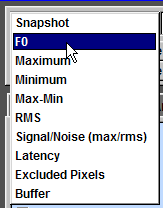
Switch from "Snapshot" to "F0".
|
|
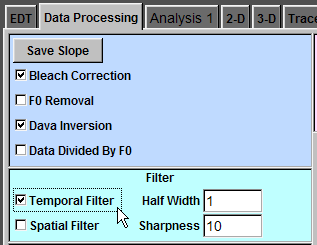
Click "Save Slope".
Check "Bleach Correction".
Check "Data Inversion".
Check "Temporal Filter".
|
|
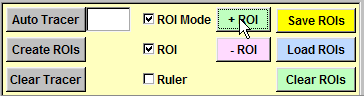
Check "ROI Mode".
Click "+ ROI".
|
|
|
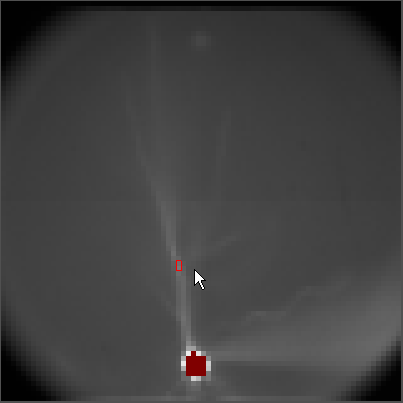
Click and drag to change the location and the size of ROI.
|
|
|
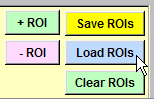
Click "Save ROIs" and save ROI information to a file.
|

|
|
Uncheck "Setting Match Check".
|
|
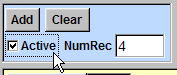
1. Click ">" button by "Record No".
2. Click "Add" button.
Repeat steps 1 and 2 until all traces are added to the memory.
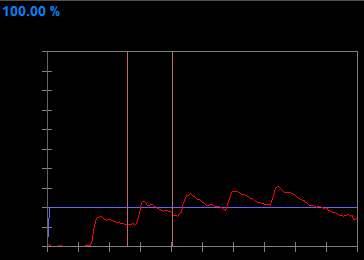
Check "Active" to show the averaged traces.
The trace window shows the baseline corrected and averaged trace (red).
The blue trace indicates the intervals between two consecutive points (in this case,
2 ms). You can ignore this blue trace.
|


|
|
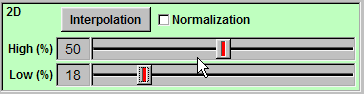
You can adjust the contrast by sliding "High" and "Low" boundary
sliders. It won't affect the calculated values.
|

|
|
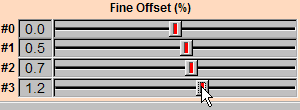
If the offset is not correct, adjust "#1" to "#3" channels in
"Fine Offset (%)" panel so the background is uniform.
|

|
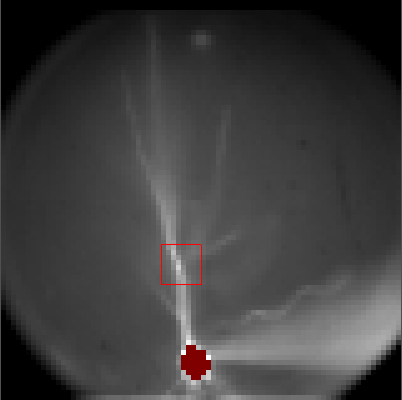
Click and drag to change the location and the size of ROI. Save it to a .roi file.
Click "Save BG2 (F0)" to save the background level in the computer. Ephic finds
the pixel with the lowest F0 and saves it's F0 as the background fluorescence. |

|
|
Click "Load ROIs" and select the file containing the region of interest.
|
|
Check "Background Subtraction".
Check "Baseline Removal".
Check "Data Divided by F0".
|

|
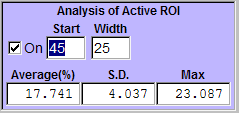
To measure the first peak, check "On"
box and type "20" in the "Start"
box and press "Enter".
Type "25" in the "Width" box and press "Enter".
These settings correspond to an analysis window from 40 ms to 90 ms since the
sampling rate is 500 Hz (2 ms between two consecutive points). The two orange
vertical lines indicate the boundaries of the analysis period.
"15.228" in "Max" is the peak value.
|


|
To measure the second peak, type "45" in
the "Start" box and press "Enter".
"23.087" in "Max" is the peak value of the second peak.
|
|