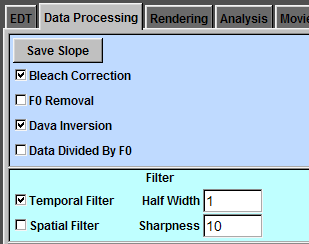
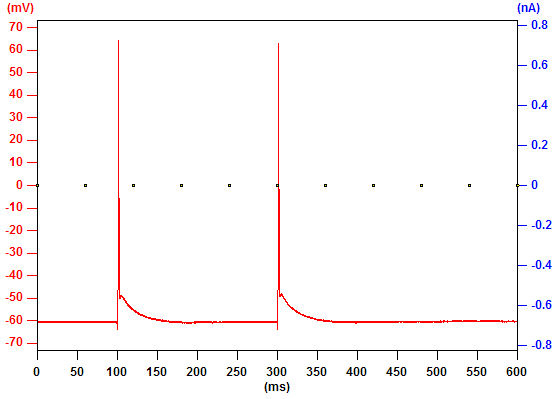
We first load the baseline record and click "Save Slope". Check "Bleach Correction" and "Data Inversion".
We check "Temporal Filter" with "Half Width = 1" to reduce noise.
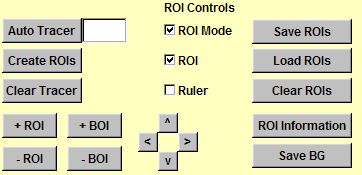
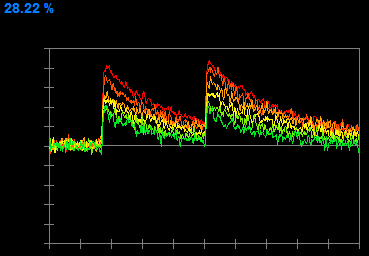
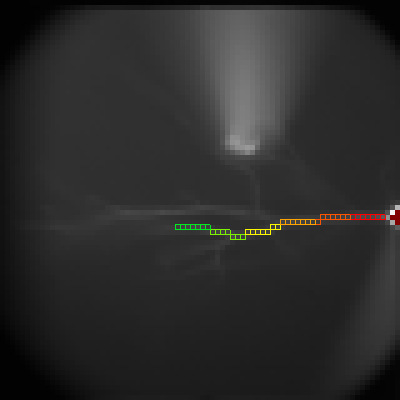
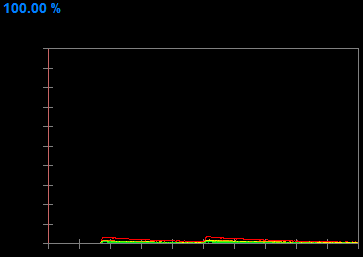
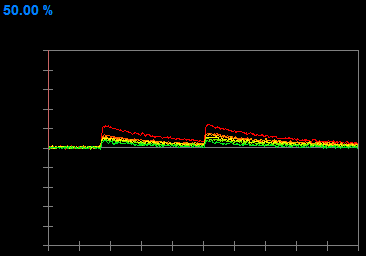
Create ROIs along the dendrite. The corresponding traces are displayed in the imaging trace window.
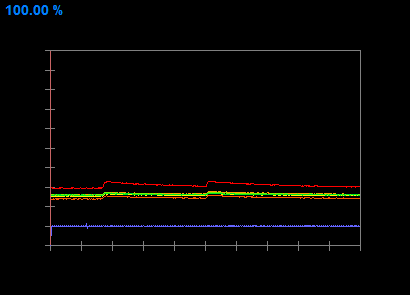
The blue trace in the imaging trace window indicates the interval between two consecutive points. The height is one unit from the beginning to the end, indicating the interval is 1 ms from the beginning to the end without missing any frame. You can hide this trace by unchecking the "Interval" box.
The number at the top left corner is the upper boundary of the window.
Average Two Records
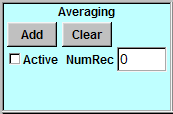
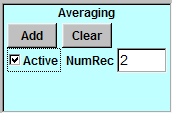
Click "Add" button in the "Averaging" panel.
Go to the next record and click "Add" button again. You will see the "NumRec" box display "2", indicating there are two records in the buffer.
Check "Active" and the imaging window and the imaging trace window will display the averaged data. You might notice the noise is lower.
To clear the data in the buffer, click "Clear" button. The number in the "NumRec" box will become "0" and the "Active" box will be unchecked automatically.
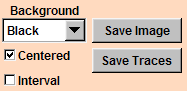
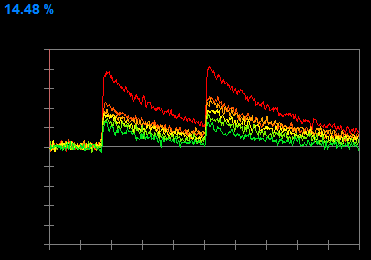
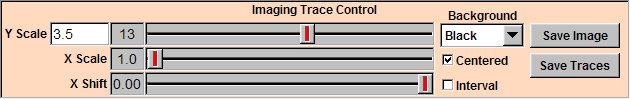
To translate the baseline to the middle of the window, check "Centered".

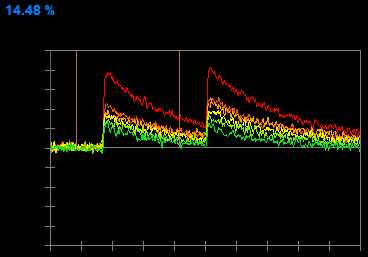
To adjust the y scale, slide the "Y Scale" slider. Now, the upper boundary is 14.48%.
You can adjust the x scale by sliding the "X Scale" slider. You can also translate the trace along the x axis by sliding the "X Shift" slider.
You can change the background color to white by clicking "Background" and select "White".
You can save the imaging trace window to a TGA file by clicking "Save Image" and following the instructions.
You can save the traces to a plain text file by clicking "Save Traces" and following the instructions.
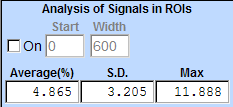
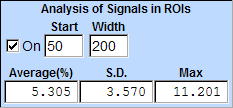
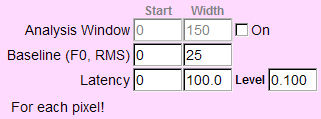
To measure these characteristics in a specified period, check "On" box, type in the start point and the width in the "Start" and the "Width" boxes, and press "Enter". You will see two orange vertical lines indicating the boundaries of this analysis window.
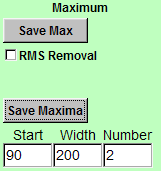
To subtract RMS value from the max, check "RMS Removal" box. The RMS value is calculated in the period defined in the "Data Processing" tab.
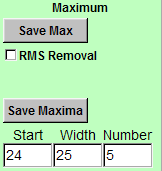
"Max.txt"
No	Max
0	11.2013
1	6.5584
2	5.56005
3	4.8601
4	4.183
5	3.751
"Maxima.txt"
No	Max1	Max2
0	11.2013	11.8885
1	6.5584	7.38292
2	5.56005	7.11527
3	4.8601	5.44764
4	4.183	4.79142
5	3.751	3.58588
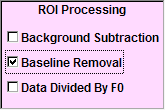
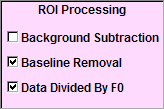
Background Subtraction
Create background ROIs. Click "Save BG" to save the minimum F0 in the box to a background buffer.
Load original ROIs and check "Background Subtraction".